


An impressive range of products
Radiological Imaging Technology
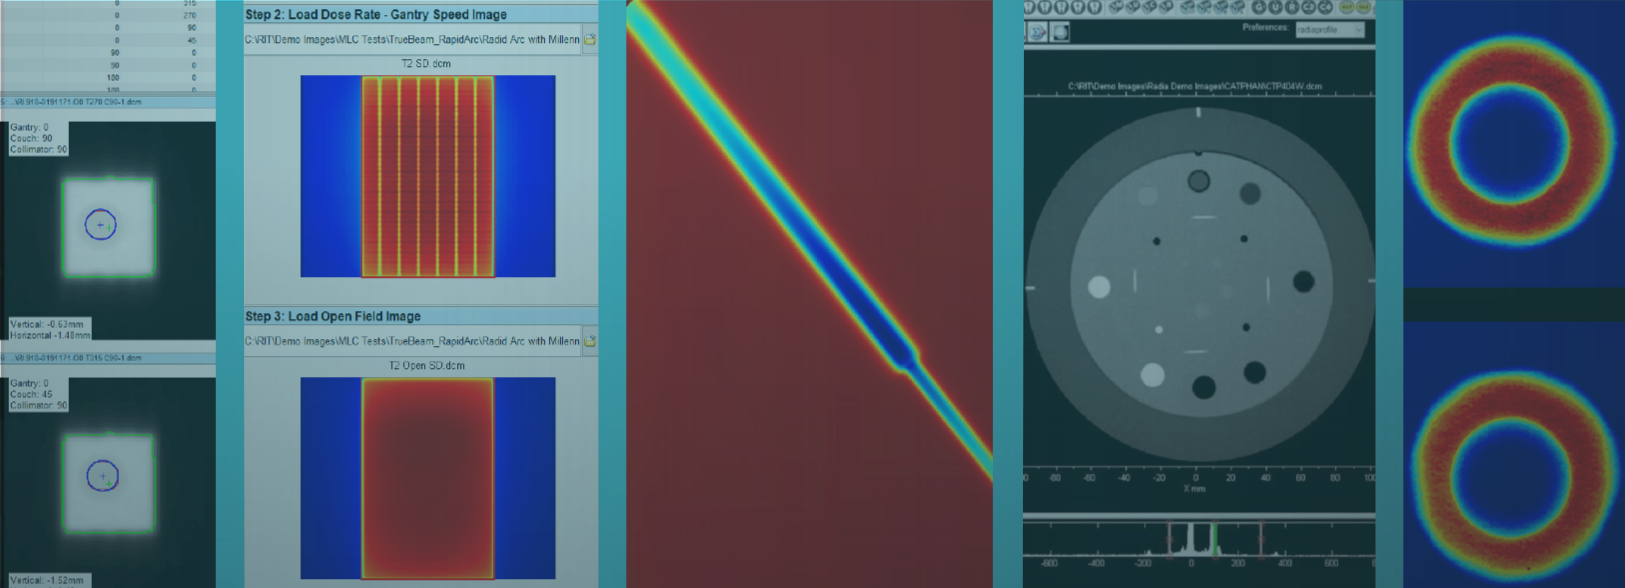
Machine QA MLC QA Patient QA Imaging QA
RITtrend™

The all-in-one statistical database tracking solution that stores data for all your department's measurements
RITtrend™ allows you to view your current and historical data, and based on any identified trends, establish well-defined, well-reasoned tolerance specifications that are particular to your machine. From within RITtrend™, you can set minimum and maximum values, view moving means, identify outliers, and monitor trends or drift.
Streamlined Interface
Run a test analysis routine, and with one click, add the analysis record to the RITtrend™ SQL-based database. All common tasks (such as as querying, managing tolerances, and SPC limits) are simplified to maximize efficiency and reduce the time it takes by more than 80%. The intuitive interface allows for dynamic visualization and management of large homogeneous data sets, generated from many MLC tests.
Flexible Data Queries
Use Query Builder selections to extract data using customizable queries to sort and report multiple criteria:- Date
- User
- Equipment
- Any pre-determined, custom field for data you need
Customizable Reporting
Visually view your data in a statistical process control chart, tabular format, or a customizable RITG142 report.

Database Location Flexibility
Conveniently locate your database anywhere on your local machine, a network, or in the cloud.
Alerts
Your data is automatically compared to your specifications with discrepancy alerts via email when the data exceeds customizable warning and failure limits or SPC control limits.
RITtrend™ is a trademark of Radiological Imaging Technology, Inc.
